Stellar Analysis
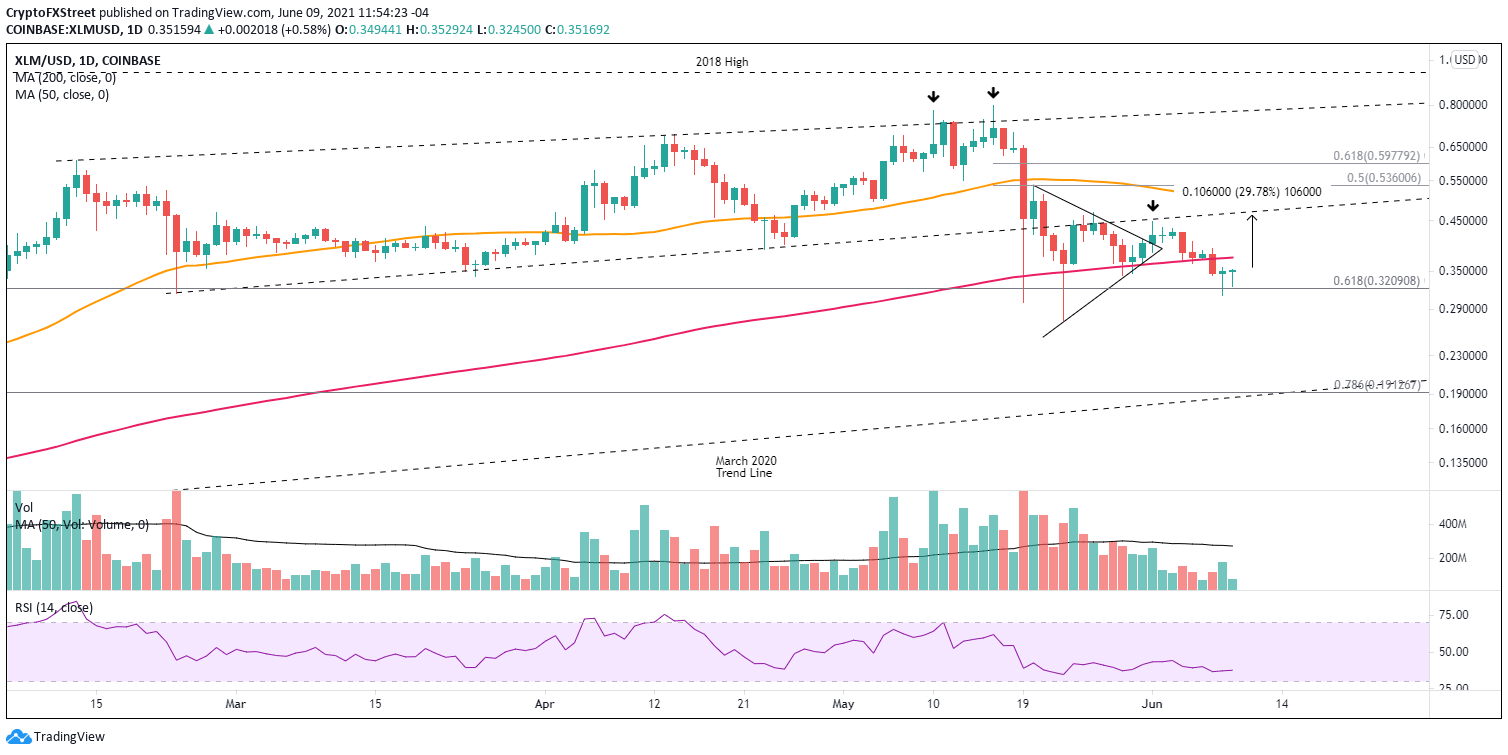
- Stellar price forms a bullish hammer candlestick pattern on the daily chart.
- XLM rests below the strategically important 200-day simple moving average (SMA).
- 61.8% Fibonacci retracement of the March 2020-May 2021 rally providing support during this pullback.
Stellar price struck support at the 61.8% retracement level yesterday before rebounding to close positive on a day that initially looked bearish for the cryptocurrency complex.
Join us on FB and Twitter to stay updated on the latest market events.