انواع همبستگی جفت ارزها

How to Use Fibonacci to Place Your Stop so You Lose Less Money

You can’t just enter a trade based on Fib levels without having a clue where to exit.

Your account will just go up in flames and you will forever blame Fibonacci, cursing his name in Italian.

In this lesson, you’ll learn a couple of techniques to set your stops when you decide to use them trusty Fib levels.

These are simple ways to set your stop and the rationale behind each method.

Method #1: Place Stop Just Past Next Fib

The first method is to set your stop just past the next Fibonacci level.

If you were planning to enter at the 38.2% Fib level, then you would place your stop beyond the 50.0% level.

If you felt like the 50.0% level would hold, then you’d put your stop past the 61.8% level and so on and so forth. Simple, right?

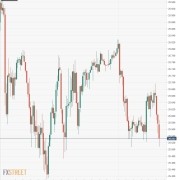
Let’s take another look at that 4-hour EUR/USD chart we showed you back in the Fibonacci retracement lesson.

Aggressive way: Place stop just past the next Fibonacci retracement level

If you had shorted at the 50.0%, you could have placed your stop loss order just past the 61.8% Fib level.

The reasoning behind this method of setting stops is that you believed that the 50.0% level would hold as a resistance point. Therefore, if the price were to rise beyond this point, your trade idea would be invalidated.

The problem with this method of setting stops is that it is entirely dependent on you having a perfect entry.

Setting a stop just past the next Fibonacci retracement level assumes that you are really confident that the support or resistance area will hold. And, as we pointed out earlier, using drawing tools isn’t an exact science.

The market might shoot up, hit your stop, and eventually go in your direction. This is usually when we’d go to a corner, and start hitting our head on the wall.

We’re just warning you that this might happen, sometimes a few times in a row, so make sure you limit your losses quickly and let your winners run with the trend.

It might be best if you used this type of stop placement method for short-term, intraday trades.

Method #2: Place Stop Past Recent Swing High/Low

Now, if you want to be a little safer, another way to set your stops would be to place them past the recent Swing High or Swing Low.

For example, when the price is an uptrend and you’re in a long position, you can place a stop loss just below the latest Swing Low which acts as a  potential support level.

When the price is in a downtrend and you’re in a short position, you can place a stop loss just above the Swing High which acts as a potential resistance level.

This type of stop loss placement would give your trade more room to breathe and give you a better chance for the market to move in favor of your trade.

Conservative way: Place stop past the Swing High/Low

If the market price were to surpass the Swing High or Swing Low, it may indicate that a reversal of the trend is already in place.

This means that your trade idea or setup is already invalidated and that you’re too late to jump in.

Setting larger stop losses would probably be best used for longer-term, swing-type trades, and you can also incorporate this into a “scaling in” method, which you will learn later on in this course.

Of course, with a larger stop, you also have to remember to adjust your position size accordingly.

If you tend to trade the same position size, you may incur large losses, especially if you enter at one of the earlier Fib levels.

This can also lead to some unfavorable reward-to-risk ratios, as you may have a wide stop that isn’t proportional to your potential reward.

So which way is better?

The truth is, just like in combining the Fibonacci retracement tool with support and resistance, trend lines, and candlesticks to find a better entry, it would be best to use your knowledge of these tools to analyze the current environment to help you pick a good stop loss point.

As much as possible, you shouldn’t rely solely on Fibonacci levels as support and resistance points as the basis for stop loss placement.

Remember, stop loss placement isn’t a sure thing.

But if you can tilt the odds in your favor by combining multiple tools, it could help give you a better exit point, more room for your trade to breathe, and possibly a better reward-to-risk ratio trade.

الگو ی انبرک

How to Use Fibonacci Extensions to Know When to Take Profit

The next use of Fibonacci will be using them to find “take profit” targets.

Gotta always keep in mind “Zombieland Rules of Survival #22”:

When in doubt, know your way out!

Let’s start with an example of an uptrend.

In an uptrend, the general idea is to take profits on a long trade at a Fibonacci Price Extension Level.

You determine the Fibonacci extension levels by using three mouse clicks.

First, click on a significant Swing Low, then drag your cursor and click on the most recent Swing High. Finally, drag your cursor back down and click on any of the retracement levels.

This will display each of the Price Extension Levels showing both the ratio and corresponding price levels. Pretty neat, huh?


Let’s go back to that example with the USD/CHF chart we showed you in the previous lesson.


Former resistance turned support at 1.0510 held nicely

The 50.0% Fib level held strongly as support and, after three tests, the pair finally resumed its uptrend. In the chart above, you can even see the price rise above the previous Swing High.

Let’s pop on the Fibonacci extension tool to see where would have been a good place to take off some profits.

Fib extensions help us spot potential take profit points

Here’s a recap of what happened after the retracement Swing Low occurred:

  • Price rallied all the way to the 61.8% level, which lined up closely with the previous Swing High.
  • It fell back to the 38.2% level, where it found support
  • Price then rallied and found resistance at the 100% level.
  • A couple of days later, the price rallied yet again before finding resistance at the 161.8% level.

As you can see from the example, the 61.8%, 100%, and 161.8% levels all would have been good places to take off some profits.

Now, let’s take a look at an example of using Fibonacci extension levels in a downtrend.


In a downtrend, the general idea is to take profits on a short trade at a Fibonacci extension level since the market often finds support at these levels.

Let’s take another look at that downtrend on the 1-hour EUR/USD chart we showed you in the Fib Sticks lesson.

Buyers could not break through the 61.8% Fib. Sellers jumped back in and brought price back down to test former lows

Here, we saw a doji form just under the 61.8% Fib level. Price then reversed as sellers jumped back in, and brought price all the way back down to the Swing Low.

Let’s put up that Fib Extension tool to see where would have been some good places to take profits had we shorted at the 61.8% retracement level.

The 38.2%, 50.0%, and 61.8% extension levels would have all been good places to take profit

Here’s what happened after the price reversed from the Fibonacci retracement level:

  • Price found support at the 38.2% level
  • The 50.0% level held as initial support, then became an area of interest
  • The 61.8% level also became an area of interest, before price shot down to test the previous Swing Low
  • If you look ahead, you’ll find out that the 100% extension level also acted as support

We could have taken off profits at the 38.2%, 50.0%, or 61.8% levels. All these levels acted as support, possibly because other traders were keeping an eye out for these levels for profit-taking as well.

The examples illustrate that price finds at least some temporary support or resistance at the Fibonacci extension levels – not always, but often enough to correctly adjust your position to take profits and manage your risk.

Of course, there are some problems to deal with here.

First, there is no way to know which exact Fibonacci extension level will provide resistance.

ANY of these levels may or may not act as support or resistance.

Another problem is determining which Swing Low to start from in creating the Fibonacci extension levels.

One way is from the last Swing Low as we did in the examples; another is from the lowest Swing Low of the past 30 bars.

Again, the point is that there is no one right way to do it, but with a lot of practice, you’ll make better decisions of picking Swing points.

For now, let’s move on to stop loss placement!

How to Use Fibonacci Retracement with Japanese Candlesticks

In this lesson, we’re going to teach you how to combine the Fibonacci retracement tool with your knowledge of Japanese candlestick patterns that you learned in Grade 2.


When combining the Fibonacci retracement tool with candlestick patterns, we are actually looking for exhaustive candlesticks.

If you can tell when buying or selling pressure is exhausted, it can give you a clue of when price may continue trending.


We here at BabyPips.com like to call them “Fibonacci Candlesticks,” or “Fib Sticks” for short. Pretty catchy, eh? Let’s take a look at an example to make this clearer.


Below is a 1-hour chart of EUR/USD.

1-hour chart of EUR/USD with Fibonacci retracement levels

The pair seems to have been in a downtrend the past week, but the move seems to have paused for a bit.

Will there be a chance to get in on this downtrend? You know what this means. It’s time to take the Fibonacci retracement tool and get to work!

As you can see from the chart, we’ve set our Swing High at 1.3364 on March 3, with the Swing Low at 1.2523 on March 6.

Since it’s a Friday, you decided to just chill out, take an early day off, and decide when you wanna enter once you see the charts after the weekend.

Bullish green candle. Is EUR/USD headed for new highs?

Whoa! By the time you popped open your charts, you see that EUR/USD has shot up quite a bit from its Friday closing price.

While the 50.0% Fib level held for a bit, buyers eventually took the pair higher. You decide to wait and see whether the 61.8% Fib level holds.

After all, the last candle was pretty bullish! Who knows, the price just might keep shooting up!

Doji forms on the 61.8% Fib. Potential reversal

Well, will you look at that? A long-legged doji has formed right smack on the 61.8% Fibonacci retracement level.

If you paid attention in Grade 2, you’d know that this is an “exhaustive candle.”


Has buying pressure died down? Is resistance at the Fibonacci retracement level holding?

It’s possible. Other traders were probably eyeing that Fib level as well.

Is it time to short? You can never know for sure (which is why risk management is so important), but the probability of a reversal looks pretty darn good!

Buyers ran out of steam. Resistance at 61.8% Fibonacci retracement held

If you had shorted right after that doji had formed, you could have made some serious profits.

Right after the doji, the price stalled for a bit before heading straight down. Take a look at all those red candles!

It seems that buyers were indeed pretty tired, which allowed sellers to jump back in and take control.

Eventually, the price went all the way back down to the Swing Low. That was a move of about 500 pips! That could’ve been your trade of the year!


Looking for “Fib Sticks” can be really useful, as they can signal whether a Fibonacci retracement level will hold.

If it seems that price is stalling on a Fib level, chances are that other traders may have put some orders at those levels.

This would act as more confirmation that there is indeed some resistance or support at that price.

Another nice thing about Fib Sticks is that you don’t need to place limit orders at the Fib levels.

You may have some concerns about whether the support or resistance will hold since we are looking at a “zone” and not necessarily specific levels.

This is where you can use your knowledge of candlestick formations.

You could wait for a Fib Stick to form right below or above a Fibonacci retracement level to give you more confirmation on whether you should put in an order.

If a Fib stick does form, you can just enter a trade at the market price since you now have more confirmation that level could be holding.

How to Use Fibonacci Retracement with Trend Lines

Remember that whenever a pair is in a downtrend or uptrend, traders use Fibonacci retracement levels as a way to get in on the trend.


So why not look for levels where Fib levels line up right smack with the trend?

Here’s a 1-hour chart of AUD/JPY. As you can see, the price has been respecting a short-term ascending trend line over the past couple of days.

Rising trend line on 1-hour chart of AUD/JPY

You think to yourself, “Hmm, that’s a sweet uptrend right there. I wanna buy AUD/JPY, even if it’s just for a short-term trade. I think I’ll buy once the pair hits the trend line again.”


Before you do that though, why don’t you reach for your forex toolbox and get that Fibonacci retracement tool out? Let’s see if we can get a more exact entry price.


Fibonacci retracement levels intersecting with rising trend line. Potential support?

Here we plotted the Fibonacci retracement levels by using the Swing low at 82.61 and the Swing High at 83.84.

Notice how the 50.0% and 61.8% Fib levels are intersected by the rising trend line.

Could these levels serve as potential support levels? There’s only one way to find out!

Trend line and support at 61.8% Fibonacci retracement level hold

Guess what? The 61.8% Fibonacci retracement level held, as price bounced there before heading back up. If you had set some orders at that level, you would have had a perfect entry!

A couple of hours after touching the trend line, price zoomed up like Astro Boy bursting through the Swing High.

Aren’t you glad you’ve got this in your trading toolbox now?

As you can see, it does pay to make use of the Fibonacci retracement tool, even if you’re planning to enter on a retest of the trend line.

The combination of both a diagonal and a horizontal support or resistance level could mean that other traders are eying those levels as well.


Take note though, as, with other drawing tools, drawing trend lines can also get pretty subjective.

You don’t know exactly how other traders are drawing them, but you can count on one thing – that there’s a trend!

If you see that an uptrend is developing, you should be looking for ways to go long to give you a better chance of a profitable trade.

You can use the Fibonacci retracement tool to help you find potential entry points

الگو ی انبرک

Fibonacci Retracements are NOT Foolproof

Well, seeing as how Fibonacci levels are used to find support and resistance levels, this also applies to Fibonacci!

Fibonacci retracements do NOT always work! They are not foolproof.

Let’s go through an example when the Fibonacci retracement tool fails.

Below is a 4-hour chart of GBP/USD.

Here, you see that the pair has been in a downtrend, so you decided to take out your Fibonacci retracement tool to help you spot a good entry point. You use the Swing High at 1.5383, with a swing low at 1.4799.

You see that the pair has been stalling at the 50.0% level for the past couple of candles.

You say to yourself, “Oh man, that 50.0% Fib level! It’s holding baby! Time to short this sucka!”


You short at market and start daydreaming that you’ll be driving down Rodeo Drive in your new Maserati with Scarlett Johansson (or if you’re a lady trader, Ryan Gosling) in the passenger seat…


Resistance at the 50.0% Fibonacci retracement seems to be holding

Now, if you really did put an order at that level, not only would your dreams go up in smoke, but your account would take a serious hit if you didn’t manage your risk properly!

Take a look at what happened.

Fibonacci retracement levels failed to hold and price broke through for new highs

It turns out that that Swing Low was the bottom of the downtrend and the price began to rally above the Swing High point.

What’s the lesson here?

While Fibonacci retracement levels give you a higher probability of success, like other technical tools, they don’t always work. You don’t know if the price will reverse to the 38.2% level before resuming the trend.

Sometimes it may hit 50.0% or the 61.8% levels before turning around. Heck, sometimes the price will just ignore Mr. Fibonacci and blow past all the levels just like how Lebron James bullies his way through the lane with sheer force.

Remember, the market will not always resume its uptrend after finding temporary support or resistance, but instead continue to go past the recent Swing High or Low.


Another common problem in using the Fibonacci retracement tool is determining which Swing Low and Swing High to use.

People look at charts differently, look at different time frames, and have their own fundamental biases. It is likely that Stephen from Pipbuktu and the girl from Pipanema have different ideas of where the Swing High and Swing Low points should be.

The bottom line is that there is no absolute right way to do it, especially when the trend on the chart isn’t so clear. Sometimes it becomes a guessing game.

That’s why you need to hone your skills and combine the Fibonacci retracement tool with other tools in your forex toolbox to help give you a higher probability of success.


How to Use Fibonacci Retracements

It’s kinda like comparing it to NBA legend Kobe Bryant.


Kobe was one of the greatest basketball players of all time, but even he couldn’t win those titles by himself.

He needed some backup.


Similarly, the Fibonacci retracement tool should be used in combination with other tools.

In this lesson, let’s take what you’ve learned so far and try to combine them to help us spot some sweet trade setups.

Are y’all ready? Let’s get this pip show on the road!

Fibonacci Retracement + Support and Resistance

One of the best ways to use the Fibonacci retracement tool is to spot potential support and resistance levels and see if they line up with Fibonacci retracement levels.


If Fibonacci levels are already support and resistance levels, and you combine them with other price areas that a lot of other traders are watching, then the chances of price bouncing from those areas are much higher.


Let’s look at an example of how you can combine support and resistance levels with Fibonacci levels. Below is a daily chart of USD/CHF.

Daily chart of USD/CHF with Fibonacci retracement levels

As you can see, it’s been on an uptrend recently. Look at all those green candles!

You decide that you want to get in on this long USD/CHF bandwagon.

But the question is, “When do you enter?”

You bust out the Fibonacci retracement tool, using the low at 1.0132 on January 11 for the Swing Low and the high at 1.0899 on February 19 for the Swing High.

Now your chart looks pretty sweet with all those Fibonacci retracement levels.

Resistance turned support at 50.0% Fib?

Now that we have a framework to increase our probability of finding a solid entry, we can answer the question “Where should you enter?”

You look back a little bit and you see that the 1.0510 price was good resistance level in the past and it just happens to line up with the 50.0% Fibonacci retracement level.

Now that it’s broken, it could turn into support and be a good place to buy.

Resistance turned support at 50.0% Fib holds and price eventually makes a new high

If you did set an order somewhere around the 50.0% Fib level, you’d be a pretty happy camper!

There would have been some pretty tense moments, especially on the second test of the support level on April 1.

Price tried to pierce through the support level but failed to close below it. Eventually, the pair broke past the Swing High and resumed its uptrend.


You can do the same setup on a downtrend as well. The point is you should look for price levels that seem to have been areas of interest in the past.


If you think about it, there’s a higher chance that the price will bounce from these levels.

Why?

First, as we discussed in Grade 1, previous support or resistance levels are usually good areas to buy or sell because other traders will also be eyeing these levels like a hawk.

Second, since we know that a lot of traders also use the Fibonacci retracement tool, they may be looking to jump in on these Fib levels themselves.

With traders looking at the same support and resistance levels, there’s a good chance that there are a ton of orders at those price levels.

While there’s no guarantee that the price will bounce from those levels, at least you can be more confident about your trade. After all, there is strength in numbers!

Remember that trading is all about probabilities.

If you stick to those higher-probability trades, then there’s a better chance of coming out ahead in the long run.

آشنایی با جفت ارزهای متقاطع

Fibonacci Trading

Fibonacci is a huge subject and there are many different Fibonacci studies with weird-sounding names but we’re going to stick to two: retracement and extension.


Let us first start by introducing you to the Fib man himself…Leonardo Fibonacci.


Fibonacci

No, Leonardo Fibonacci isn’t some famous chef. Actually, he was a famous Italian mathematician, also known as a super-duper uber ultra geek.

He had an “Aha!” moment when he discovered a simple series of numbers that created ratios describing the natural proportions of things in the universe.

The ratios arise from the following number series: 0, 1, 1, 2, 3, 5, 8, 13, 21, 34, 55, 89, 144…

This series of numbers is derived by starting with 0 followed by 1 and then adding 0 + 1 to get 1, the third number.

Then, adding the second and third numbers (1 + 1) to get 2, the fourth number, and so on.


After the first few numbers in the sequence, if you measure the ratio of any number to the succeeding higher number, you get .618.


For example, 34 divided by 55 equals .618.

If you measure the ratio between alternate numbers you get .382.

For example, 34 divided by 89 = 0.382 .

You have now just experienced the Fibonacci Sequence!

Fibonacci Golden Ratio

Fibonacci Sequence

Fibonacci sequence is formed by taking 2 numbers, any 2 numbers, and adding them together to form a third number.

Then the second and third numbers are added again to form the fourth number.

And you can continue this until it’s not fun anymore.

The ratio of the last number over the second-to-the-last number is approximately equal to 1.618.

This ratio can be found in many natural objects, so this ratio is called the golden ratio.

It appears many times in geometry, art, architecture, and even on Sonic the Hedgehog.

Golden Ratio

The golden ratio is actually an irrational number, like pi, and is often denoted by the Greek letter, phi (φ).

Okay, that’s enough mumbo jumbo.

With all those numbers, you could put an elephant to sleep. We’ll just cut to the chase; these are the ratios you HAVE to know:

Fibonacci Retracement Levels

0.236, 0.382, 0.618, 0.764

Fibonacci Extension Levels

0, 0.382, 0.618, 1.000, 1.382, 1.618

You won’t really need to know how to calculate all of this. Your charting software will do all the work for you.

However, it’s always good to be familiar with the basic theory behind the indicator so you’ll have the knowledge to impress your date.

Fibonacci retracement levels work on the theory that after a big price moves in one direction, the price will retrace or return partway back to a previous price level before resuming in the original direction.

Traders use the Fibonacci retracement levels as potential support and resistance areas.

Since so many traders watch these same levels and place buy and sell orders on them to enter trades or place stops, the support and resistance levels tend to become a self-fulfilling prophecy.

Traders use the Fibonacci extension levels as profit-taking levels.

Again, since so many traders are watching these levels to place buy and sell orders to take profits, this tool tends to work more often than not due to self-fulfilling expectations.

Most charting software includes both Fibonacci retracement levels and extension level tools.

In order to apply Fibonacci levels to your charts, you’ll need to identify Swing High and Swing Low points.

Swing High is a candlestick with at least two lower highs on both the left and right of itself.

Swing Low is a candlestick with at least two higher lows on both the left and right of itself.

Did you get all that? Don’t worry, we’ll explain retracements, extensions, and most importantly, how to grab some pips using the Fibonacci tool in the following lessons.

Candlesticks with Support and Resistance

Remember, candlesticks are useless on their own, and you must always consider the market environment and what the price is telling you.


But before we begin, just a few words of caution…


As with any technical indicator or tool, if candlesticks point to a reversal or continuation that does NOT mean it will happen.

This is the forex market and nothing is set in stone!

Using Candlesticks with Support and Resistance

The simplest way to use candlesticks is with support and resistance levels.

Because support and resistance levels determine areas, where buyers and sellers have set up their defenses, looking at how candlesticks react to them, will help you greatly in predicting where price will head next.


Here’s a real forex world example:


In this scenario, you can see that there is resistance around the 1.4900 level.

You badly want to enter but you decide to wait instead because the candle that touched this level looks very bullish.

Looks like it's going to break resistance

Two candles later, you spot a nice three inside down candlestick pattern, which is considered a very potent bearish signal.

Using the formation as your sell signal confirmation, you go ahead and short the pair.

Since you’re a smart trader, you also set a stop loss above the resistance.

Three inside down formation forms. Time to sell!

Because of your high level of patience and your knowledge of candlestick formations, you have greatly increased the odds in your favor.

Let’s see what happened after you shorted…

Ka-pow! The pair almost immediately goes in your favor and nets you hundreds of pips.

You go to the nearest car dealership and buy yourself an exotic sports car.

And a jet. With matching colors.


You might be thinking, “Why do I have to pair support and resistance levels with candlesticks? I could get a lot more signals with just candlesticks and make more money!”


To answer that, take another look at the same chart of your hypothetical trade…

We’ve taken the liberty of highlighting some potential trade signals based solely on candlestick formations.

Take a look!

If you had traded on those candlesticks formations alone, you would have lost every single time!

By simply pairing candlestick formations WITH support and resistance levels, you have increased your odds your winning.

Triple Candlestick Patterns

To identify triple Japanese candlestick patterns, you need to look for specific formations that consist of three candlesticks in total.

These candlestick formations help traders determine how the price is likely to behave next.

Some three candlestick patterns are reversal patterns, which signal the end of the current trend and the start of a new trend in the opposite direction.

And other three candlestick patterns are continuation patterns, which signal a pause and then the continuation of the current trend.

Let’s take a look at the popular triple Japanese candlestick patterns.

Evening and Morning Stars

The Morning Star and the Evening Star are triple candlestick patterns that you can usually find at the end of a trend.

They are reversal patterns that can be recognized through three characteristics.

Candlestick Patterns: Morning and Evening Star

We’ll use the Evening Star Pattern on the right as an example of what you may see:

  1. The first candlestick is a bullish candle, which is part of a recent uptrend.
  2. The second candle has a small body, indicating that there could be some indecision in the market. This candle can be either bullish or bearish.
  3. The third candlestick acts as a confirmation that a reversal is in place, as the candle closes beyond the midpoint of the first candle.

Three White Soldiers and Black Crows

The Three White Soldiers pattern is formed when three long bullish candles follow a DOWNTREND, signaling a reversal has occurred.

Candlestick Patterns: Three White Soldiers and Three Black Crows

This type of triple candlestick pattern is considered as one of the most potent in-yo-face bullish signals, especially when it occurs after an extended downtrend and a short period of consolidation.


The first of the “three soldiers” is called the reversal candle. It either ends the downtrend or implies that the period of consolidation that followed the downtrend is over.


For the Three White Soldiers pattern to be considered valid, the second candlestick should be bigger than the previous candle’s body.

Also, the second candlestick should close near its high, leaving a small or non-existent upper wick.

For the Three White Soldiers pattern to be completed, the last candlestick should be at least the same size as the second candle and have a small or no shadow.

The Three Black Crows candlestick pattern is just the opposite of the Three White Soldiers.


It is formed when three bearish candles follow a strong UPTREND, indicating that a reversal is in the works.

The second candle’s body should be bigger than the first candle and should close at or very near its low.

Finally, the third candle should be the same size or larger than the second candle’s body with a very short or no lower shadow.

For the Three Black Crows pattern to be completed, the last candlestick should be at least the same size as the second candle and have a small or no shadow.

Three Inside Up and Down

Candlestick Patterns: Three Inside Up and Three Inside Down
The Three Inside Up candlestick formation is a trend-reversal pattern that is found at the bottom of a DOWNTREND.

This triple candlestick pattern indicates that the downtrend is possibly over and that a new uptrend has started.

For a valid three inside up candlestick formation, look for these properties:

  1. The first candle should be found at the bottom of a downtrend and is characterized by a long bearish candlestick.
  2. The second candle should at least make it up all the way up to the midpoint of the first candle.
  3. The third candlestick needs to close above the first candle’s high to confirm that buyers have overpowered the strength of the downtrend.

Conversely, the Three Inside Down candlestick formation is found at the top of an UPTREND.

It means that the uptrend is possibly over and that a new downtrend has started.

A Three Inside Down candlestick formation needs to have the following characteristics:

  1. The first candle should be found at the top of an uptrend and is characterized by a long bullish candlestick.
  2. The second candle should make it up all the way down the midpoint of the first candle.
  3. The third candlestick needs to close below the first candle’s low to confirm that sellers have overpowered the strength of the uptrend.

Dual Candlestick Patterns

What’s better than single candlestick patterns?

DUAL candlestick patterns!

To identify dual Japanese candlestick patterns, you need to look for specific formations that consist of TWO candlesticks in total.

Engulfing Candles

There are two types of Engulfing candles: Bullish Engulfing and Bearish Engulfing.

Candlestick Patterns: Bullish and Bearish Engulfing

The Bullish Engulfing pattern is a two candlestick reversal pattern that signals a strong up move may occur.


It happens when a bearish candle is immediately followed by a larger bullish candle.


This second candle “engulfs” the bearish candle. This means buyers are flexing their muscles and that there could be a strong up move after a recent downtrend or a period of consolidation.

On the other hand, the Bearish Engulfing pattern is the opposite of the bullish pattern.


This type of candlestick pattern occurs when the bullish candle is immediately followed by a bearish candle that completely “engulfs” it.


This means that sellers overpowered the buyers and that a strong move down could happen.

Tweezer Bottoms and Tops

Tweezer patterns are two candlestick reversal patterns.

Tweezers

This type of candlestick pattern is usually spotted after an extended uptrend or downtrend, indicating that a reversal will soon occur.

There are two types of Tweezer patterns: the Tweezer Bottom and the Tweezer Top.

Notice how the candlestick formation looks just like a pair of tweezers!

Amazing!

Candlestick Patterns: Tweezer Bottoms and Tweezer Tops

The most effective Tweezers have the following characteristics:


The first candlestick is the same as the overall trend. If the price is moving up, then the first candle should be bullish.


The second candlestick is opposite the overall trend. If the price is moving up, then the second candle should be bearish.

The shadows of the candlesticks should be of equal (or near-equal) length.