

Fibonacci Trading
Fibonacci is a huge subject and there are many different Fibonacci studies with weird-sounding names but we’re going to stick to two: retracement and extension.
Let us first start by introducing you to the Fib man himself…Leonardo Fibonacci.

No, Leonardo Fibonacci isn’t some famous chef. Actually, he was a famous Italian mathematician, also known as a super-duper uber ultra geek.
He had an “Aha!” moment when he discovered a simple series of numbers that created ratios describing the natural proportions of things in the universe.
The ratios arise from the following number series: 0, 1, 1, 2, 3, 5, 8, 13, 21, 34, 55, 89, 144…
This series of numbers is derived by starting with 0 followed by 1 and then adding 0 + 1 to get 1, the third number.
Then, adding the second and third numbers (1 + 1) to get 2, the fourth number, and so on.
After the first few numbers in the sequence, if you measure the ratio of any number to the succeeding higher number, you get .618.
For example, 34 divided by 55 equals .618.
If you measure the ratio between alternate numbers you get .382.
For example, 34 divided by 89 = 0.382 .
You have now just experienced the Fibonacci Sequence!

Fibonacci Sequence
A Fibonacci sequence is formed by taking 2 numbers, any 2 numbers, and adding them together to form a third number.
Then the second and third numbers are added again to form the fourth number.
And you can continue this until it’s not fun anymore.
The ratio of the last number over the second-to-the-last number is approximately equal to 1.618.
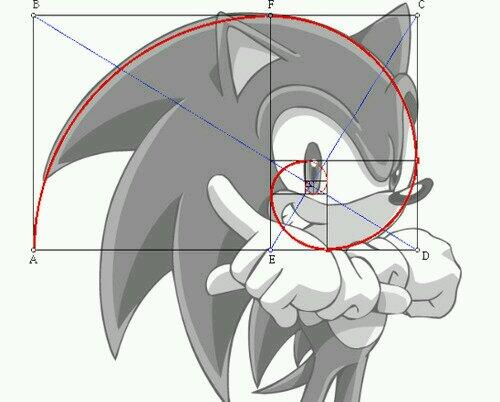
This ratio can be found in many natural objects, so this ratio is called the golden ratio.
It appears many times in geometry, art, architecture, and even on Sonic the Hedgehog.
The golden ratio is actually an irrational number, like pi, and is often denoted by the Greek letter, phi (φ).
Okay, that’s enough mumbo jumbo.
With all those numbers, you could put an elephant to sleep. We’ll just cut to the chase; these are the ratios you HAVE to know:
Fibonacci Retracement Levels
0.236, 0.382, 0.618, 0.764
Fibonacci Extension Levels
0, 0.382, 0.618, 1.000, 1.382, 1.618
You won’t really need to know how to calculate all of this. Your charting software will do all the work for you.
However, it’s always good to be familiar with the basic theory behind the indicator so you’ll have the knowledge to impress your date.
Fibonacci retracement levels work on the theory that after a big price moves in one direction, the price will retrace or return partway back to a previous price level before resuming in the original direction.
Traders use the Fibonacci retracement levels as potential support and resistance areas.
Since so many traders watch these same levels and place buy and sell orders on them to enter trades or place stops, the support and resistance levels tend to become a self-fulfilling prophecy.
Traders use the Fibonacci extension levels as profit-taking levels.
Again, since so many traders are watching these levels to place buy and sell orders to take profits, this tool tends to work more often than not due to self-fulfilling expectations.
Most charting software includes both Fibonacci retracement levels and extension level tools.
In order to apply Fibonacci levels to your charts, you’ll need to identify Swing High and Swing Low points.
A Swing High is a candlestick with at least two lower highs on both the left and right of itself.
A Swing Low is a candlestick with at least two higher lows on both the left and right of itself.
Did you get all that? Don’t worry, we’ll explain retracements, extensions, and most importantly, how to grab some pips using the Fibonacci tool in the following lessons.


Leave a Reply
Want to join the discussion?Feel free to contribute!